DEMETER
A world model for the living field.
Etherion / Messis / DEMETER
Agriculture is the oldest human technology. DEMETER is a small step in AI’s return to it: a 963M-parameter world model that learns how a crop’s state evolves under weather, and projects the field forward from its observed history. It is maintained as a forcing-conditioned predictive state, not a score.
One disclosed baseline: each field’s own continuity floor, computed on the same windows as the model error.
Held-out field-parents
Model error vs each parent’s own persistence floor
Measured result

963,270,656
parameters
30
climate anchors · every Köppen–Geiger group
16
supported crops
53
held-out field-parents
00 / Primary measured result
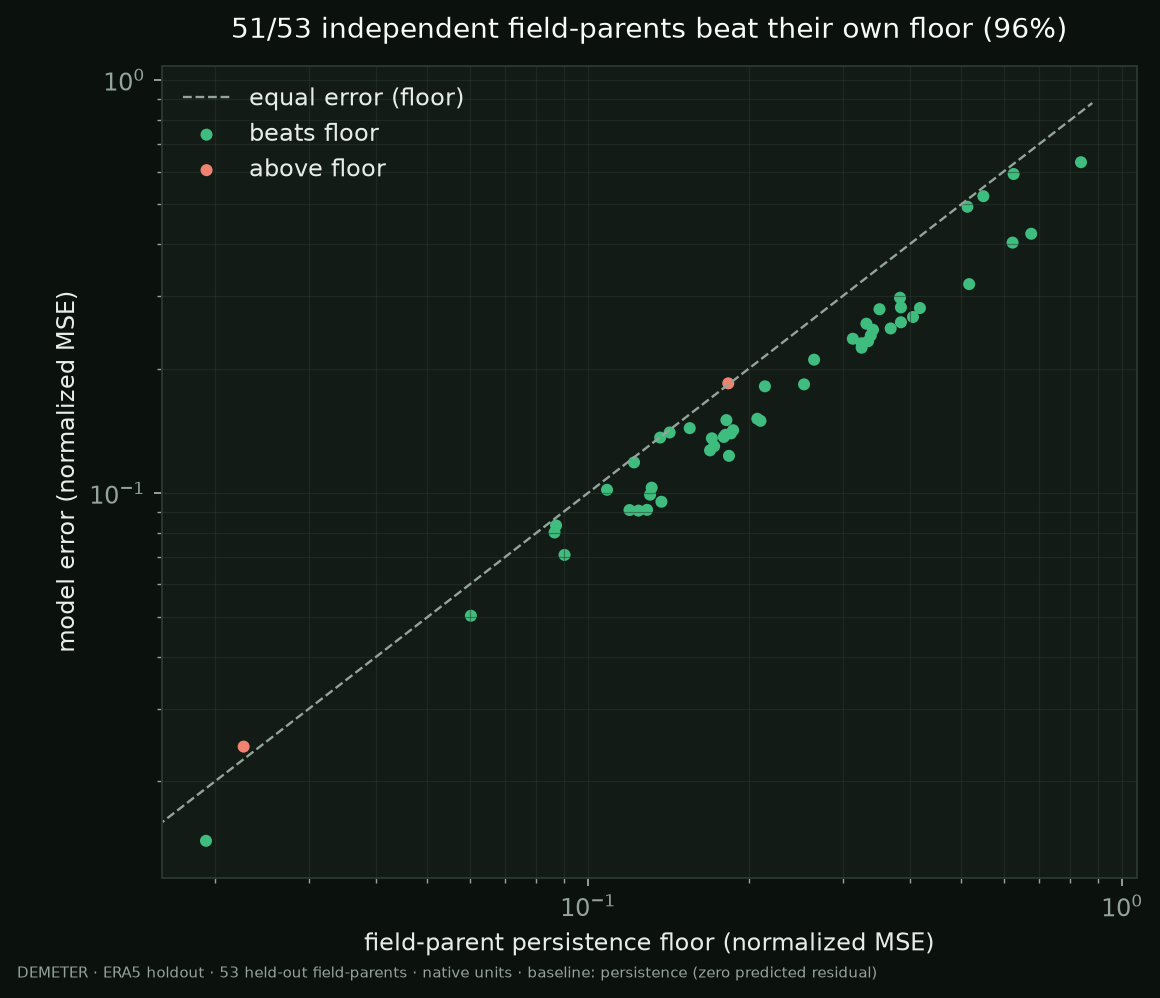
Below each field's own continuity floor, on 96% of parents.
Persistence is the honest reference for a next-state task: the next state equals the latest observed state, and the floor is the error that the naive forecast makes on the same windows. The model must beat each field's own floor — not a global average.
51 of 53 field-parents beat their own floor.
A parent is one independent held-out field series. The median next-state error is 0.0739 against a persistence floor of 0.0807; the median parent-level error is 0.1501 against 0.1869. Skill versus persistence at the median is a measured 8.4%.
Because MSE is quadratic, a mean over a few windows is a rainfall-spike detector. This release leads with the median, the floor, the parent win-rate, and the tail — never a lone mean.
51 / 53
field-parents beating their own floor
0.0739
median next-state error (normalized)
0.0807
median persistence floor (same windows)
8.4%
median skill vs persistence
0.3961 / 1.442
model p90 / p99 per-window error
0.5328 / 2.199
floor p90 / p99 per-window error
01 / Projected versus observed
Predicted versus observed, in native units.
On the same held-out fields, the projected state is compared with the observed state. Every value here is native — nothing is normalized.
| Feature / unit | Observed | Predicted | RMSE | Correlation |
|---|---|---|---|---|
| NDVI / index | 0.06955 | 0.06970 | 0.02184 | 0.973 |
| Soil moisture / m3/m3 | 0.2051 | 0.2048 | 0.1454 | 0.560 |
| Temperature / °C | 21.04 | 20.98 | 1.791 | 0.977 |
| Rainfall / mm/day | 2.398 | 2.312 | 5.547 | 0.393 |
| ET0 / mm/day | 4.447 | 4.444 | 0.8545 | 0.912 |
| Humidity / % | 59.29 | 59.28 | 8.062 | 0.931 |
| Wind speed / m/s | 2.535 | 2.580 | 0.8728 | 0.721 |
| Solar radiation / MJ/m2/day | 19.27 | 19.16 | 3.706 | 0.818 |
| GDD / °C-day | 1882.02 | 1881.85 | 1.984 | 1.000 |
| ET deficit / mm/day | 2.049 | 2.132 | 5.942 | 0.503 |
FIGURE 02
Predicted vs observed
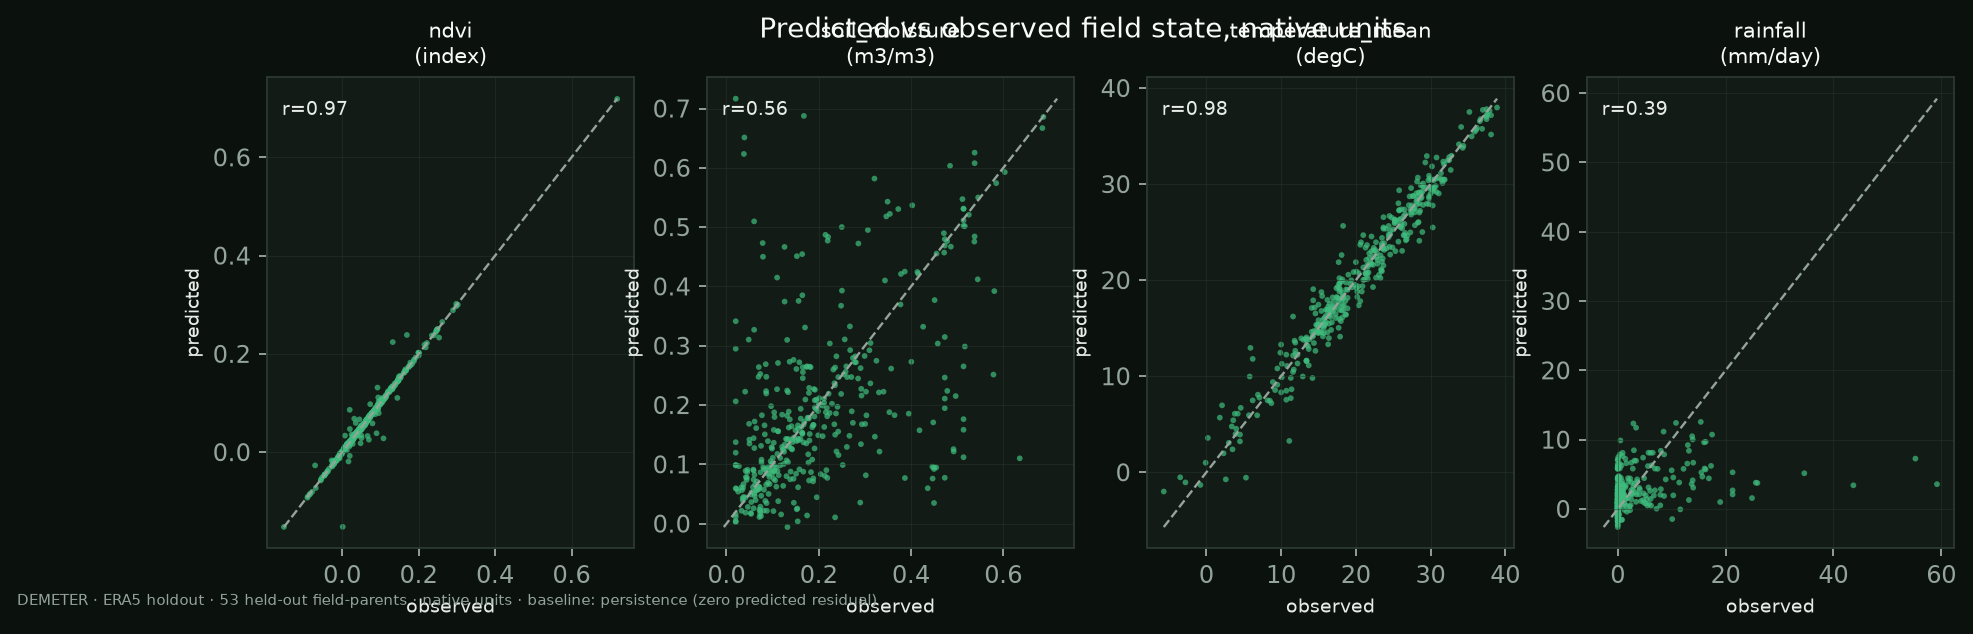
Predicted against observed field state in native units, one point per scored field, y = x drawn. Tight parity along the diagonal; the observed range on each axis keeps the error honest.
Source: Held-out field-parents · native units
02 / The tail, disclosed
No mean without spike accounting.
A handful of unpredictable target-day forcing jumps dominate any mean over a sliding-window panel — and the persistence floor is equally large on those same rows. So the tail is stated, not hidden.
FIGURE 03
Tail robustness
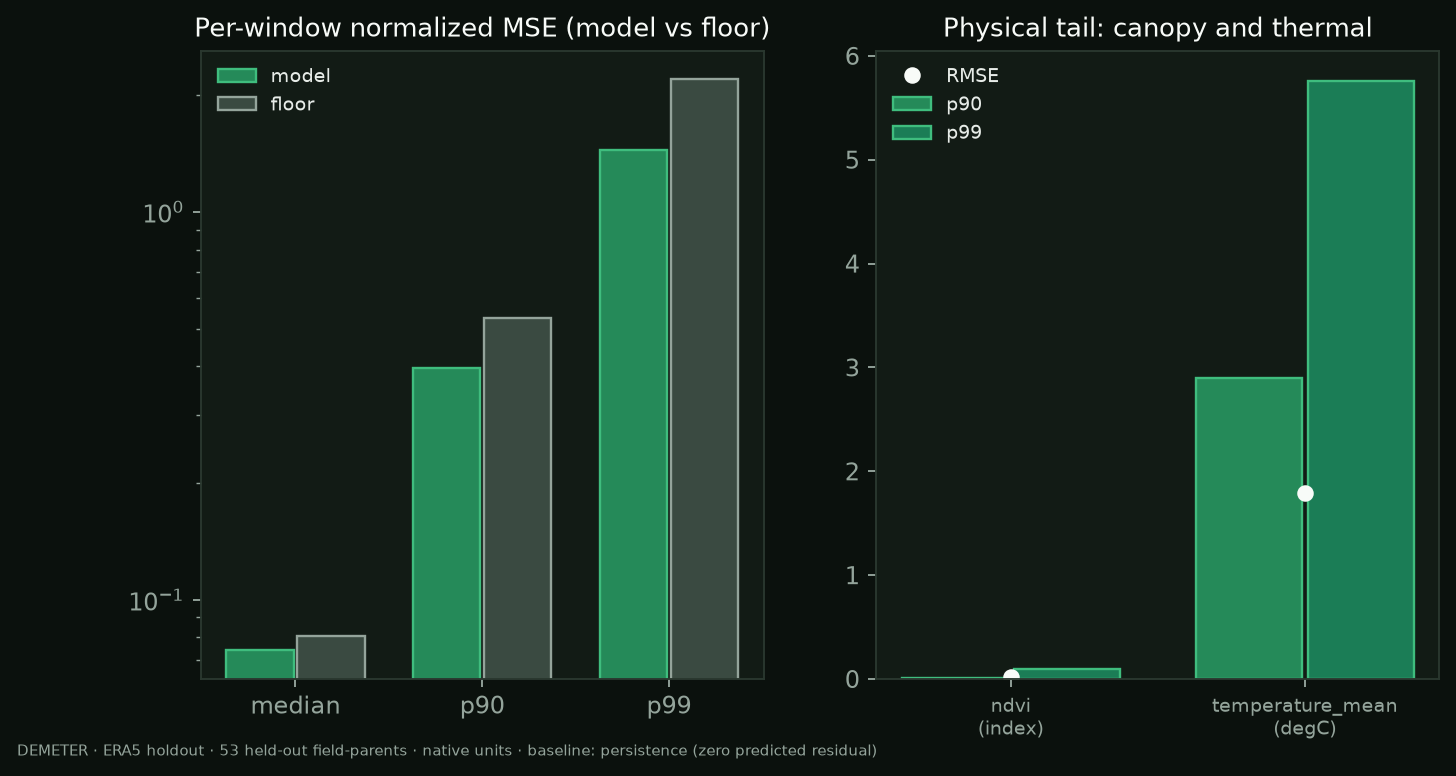
The tail is stated, not hidden. Per-window median, p90, and p99 are shown for the model and the floor, with the same-day forcing jumps that dominate any mean.
Source: p90/p99 · spike accounting disclosed
How to read a mean
The model’s median per-window error is 0.0739; its p90 is 0.3961 and its p99 is 1.442. The persistence floor on the same windows is 0.0807 at the median, 0.5328 at p90, and 2.199 at p99 — the tail is shared, not a model failure.
Every reported row in this release carries the median, the same-window floor, the parent win-rate, the per-feature physical errors, p90/p99, and skill versus persistence together.
03 / Task contract
One task, fully disclosed.
What the model receives, what it predicts, how it is scored, and what is held out.
- 01
The model processes a 60-day causal window of one field and emits 59 next-day predictions — one per position. The released result scores the window's final position.
- 02
The forcing is the ERA5 weather block; the state covers vegetation condition and soil moisture.
- 03
Fitting covers 2017–2023; the 2024–2026 streaming holdout is locked out of all fitting.
- 04
Overlapping daily windows are reduced to their distinct field-parents before any aggregate is reported.
- 05
The predicted latent is decoded with a per-checkpoint linear readout fit on training and validation, and scored once on the holdout.
Persistence floor
Persistence predicts zero residual: the next state equals the latest observed state. It is computed on the same windows as the model error, so each field carries its own difficulty. It is the only baseline in this release.
53
held-out field-parents
10,713
streaming windows
Representative rule
The published benchmark is one crop specialist, trained across 30 climate anchors that span every Köppen–Geiger group. The product is organized by crop, and all 16 ship.
04 / World operations
The result is a trajectory, not a scalar.
A tabular model returns a point estimate. A maintained predictive state supports a family of operations over the same trajectory — and keeps every step inspectable.
FIGURE 04
World operations surface
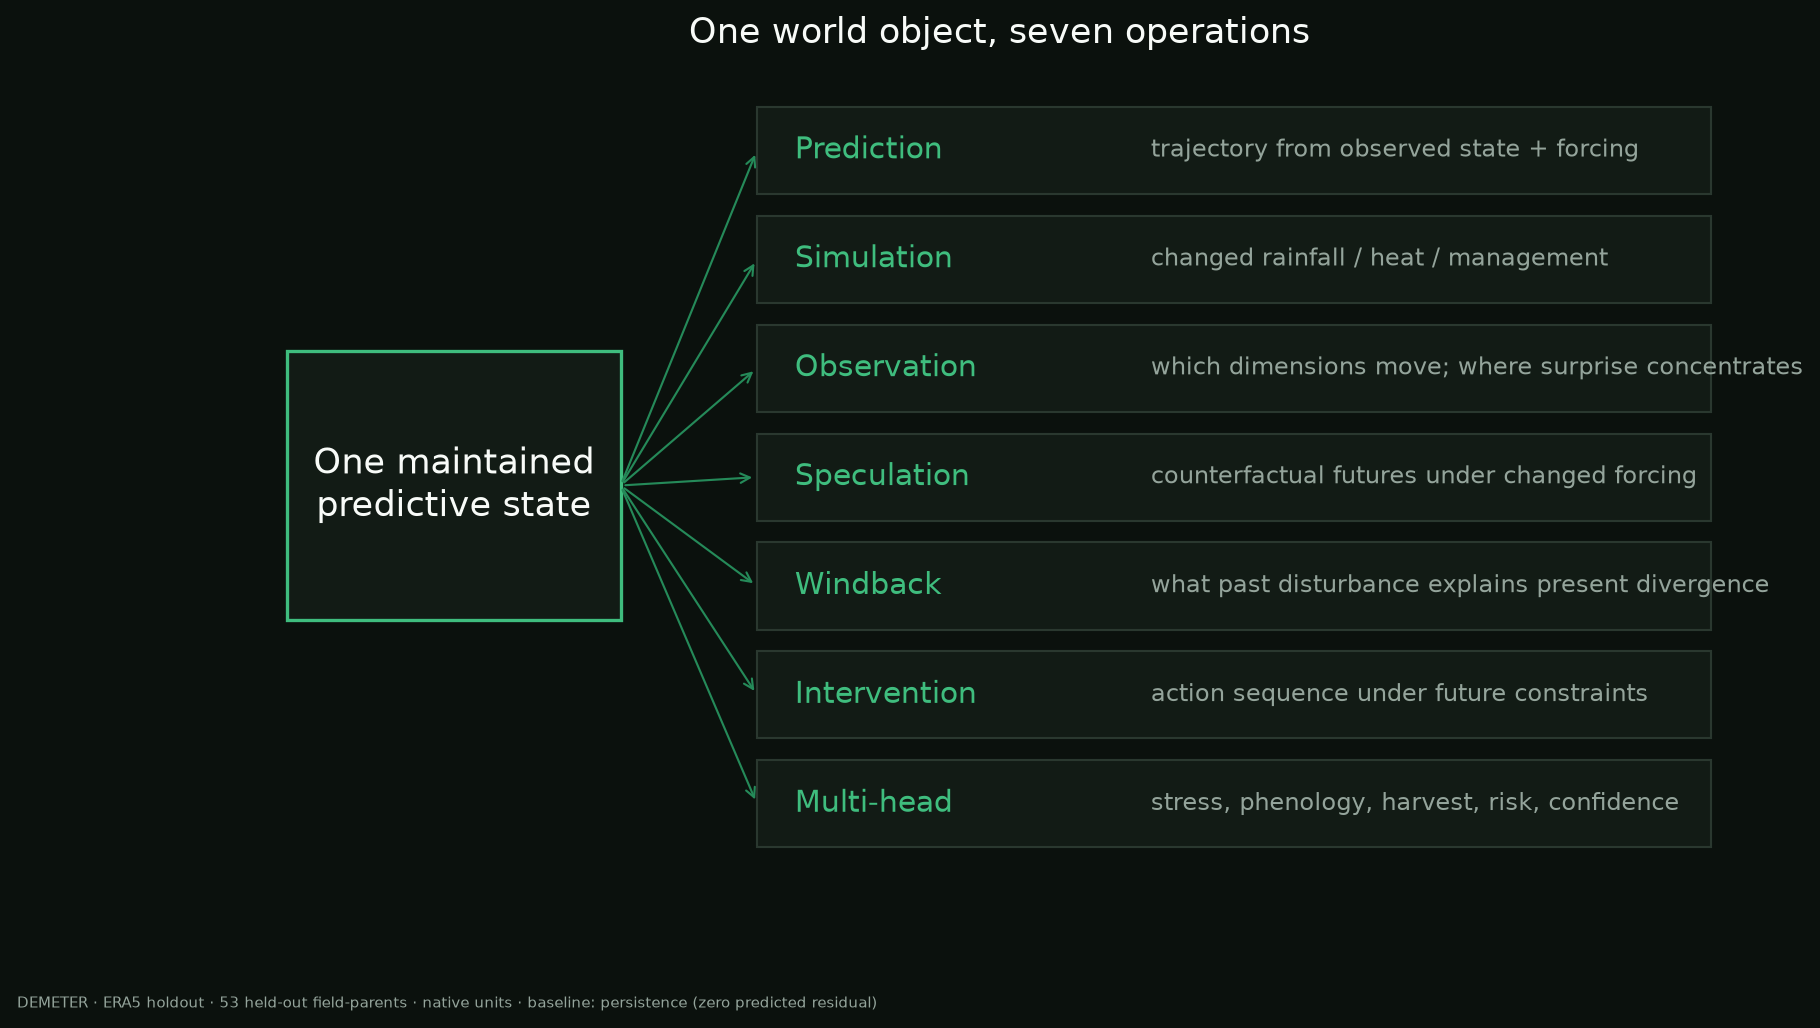
One forcing-conditioned state supports prediction, simulation, observation, speculation, windback, intervention, and multi-head inference. Operational utility requires separate policy evaluation.
Source: One maintained predictive state · roadmap surface
Prediction
The trajectory that follows an observed state and forcing.
Simulation
What changes under different rainfall, heat, or management.
Observation
Which dimensions move, and where surprise concentrates.
Speculation
Which counterfactual futures remain consistent with changed forcing.
Windback
Which past disturbance best explains present divergence.
Intervention
Which action sequence satisfies a future state constraint.
Multi-head inference
Stress, phenology, harvest, risk, and confidence on one trajectory.
Operational utility — water saved, stress avoided, intervention acceptance, and yield or quality outcomes — requires separate policy evaluation and is not folded into the predictive benchmark.
05 / World indexes
A prediction that arrives with its own reading.
One error number says how the model did on average. It cannot say what this projection rests on, how steady it is, or where it is fragile. Every DEMETER projection ships with two indexes, reported in the field's own physical units, so a number becomes a statement about one field.
Stability / Instability
What this projection is sensitive to, how steady it stays, which inputs disturb it only in combination, and how far the tail can reach. A stable field reads stable; a field sitting in an unstable regime says so — before anyone acts on it.
Attention / Influence
What the projection actually depends on, measured rather than assumed — kept deliberately separate from what the model draws upon. Where the two disagree is the finding: inputs that are read without moving the answer, and inputs that stay quiet while carrying it.
Why a maintained state, not a fit
A fitted curve returns an answer and forgets the question. Asking what a projection rests on, what would change it, and how far to lean on it requires a maintained state of the field under its weather — something that can be perturbed, rolled forward, and constrained. The indexes are not a report bolted onto a score. They are what the object is.
How to read them
These are statements about one field’s physics, not a league table. Confidence is a band for the model on that field; it does not rank one field above another.
06 / Figure set
Four figures. Each one evidence, not decoration.
Every figure is rendered from the hash-preserved holdout artifact and carries its floor and unit footer.
FIGURE 01
Parent win-rate
Every independent field-parent, plotted as model error against its own persistence floor. Points below the diagonal beat the floor: 51 of 53 parents do.
Source: 53 held-out field-parents · ERA5 holdout · persistence floor
FIGURE 02
Predicted vs observed
Predicted against observed field state in native units, one point per scored field, y = x drawn. Tight parity along the diagonal; the observed range on each axis keeps the error honest.
Source: Held-out field-parents · native units
FIGURE 03
Tail robustness
The tail is stated, not hidden. Per-window median, p90, and p99 are shown for the model and the floor, with the same-day forcing jumps that dominate any mean.
Source: p90/p99 · spike accounting disclosed
FIGURE 04
World operations surface
One forcing-conditioned state supports prediction, simulation, observation, speculation, windback, intervention, and multi-head inference. Operational utility requires separate policy evaluation.
Source: One maintained predictive state · roadmap surface
07 / Public provenance
Three public source families. One causal frame.
The benchmark uses real environmental observations. The source families are public.
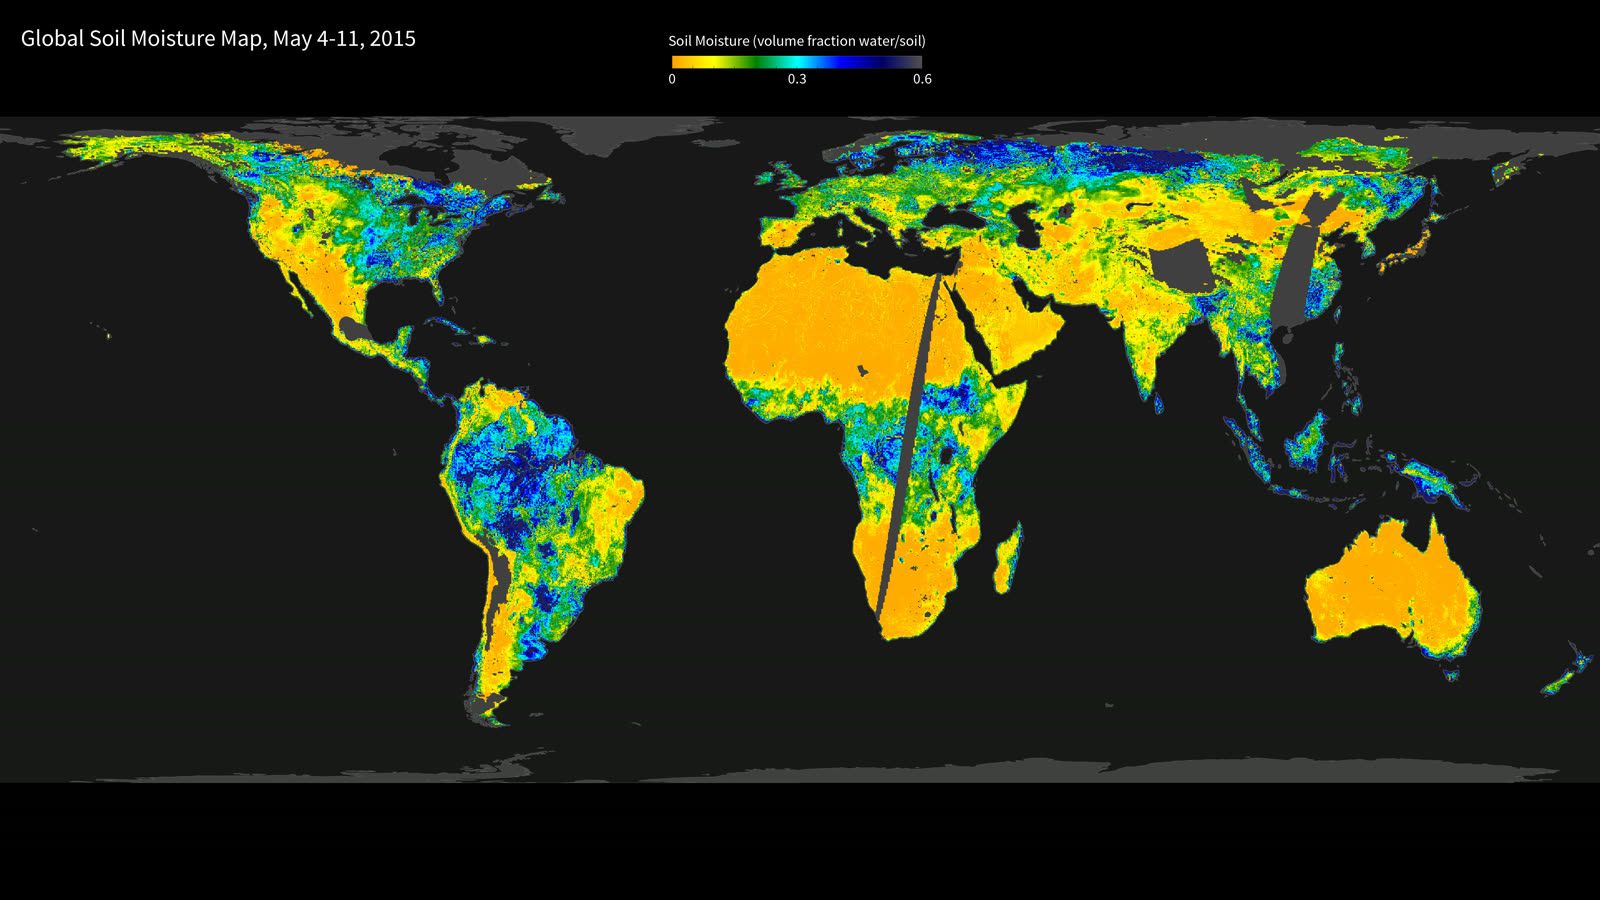
NASA SMAP
Soil evidence
Public soil-moisture observations contribute the ground-water side of a crop system's evolving condition, in native m3/m3.
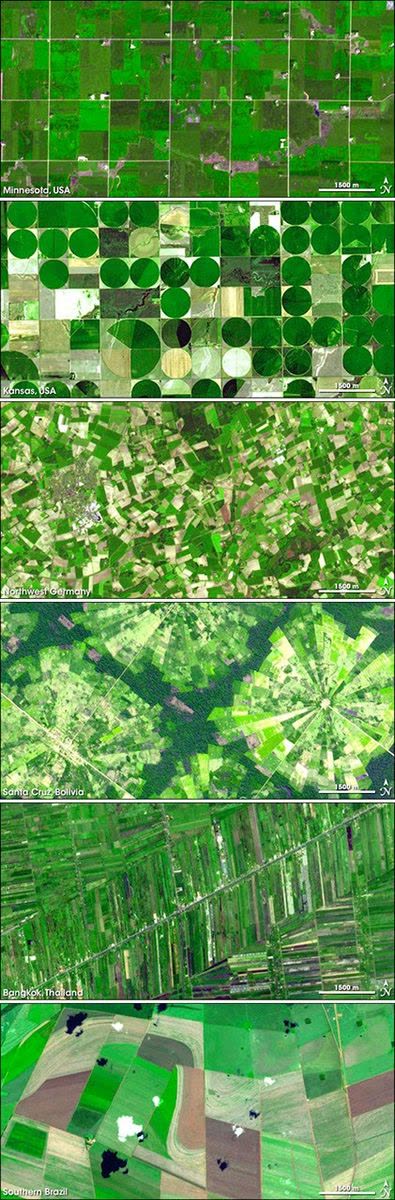
Sentinel-2
Vegetation evidence
Public satellite observations contribute canopy and vegetation evidence across the trajectory.
ERA5
Meteorological evidence
The Copernicus ERA5 reanalysis supplies the physical forcing context for the next state.
Sixteen supported crops
Maize, sorghum, pearl millet, cassava, groundnut, cowpea, rice, sweet potato, yam, sesame, soybean, coffee, wheat, sugarcane, tobacco, cocoa.
08 / Research program
Measured now. Roadmap next.
The release states one measured task contract. The research program widens the same world object without overclaiming it.
Richer temporal coverage
Longer and denser held-out history to measure how the floor moves with more distinct field-parents.
Broader operating scope
More climate anchors and more crop profiles extend the same object, each measured before it is claimed.
Spatial sensing for delicate crops
For high-value crops where geometry matters, Etherion intends to integrate spatial LiDAR insight with temporal prediction.
Measured versus future
Measured now: the next-state result on 53 held-out field-parents, with the physical table and the tail. Roadmap: richer temporal coverage, broader scope, and spatial sensing.
09 / The operating model
Messis is the path from model to observability layer.
Messis is the agricultural decision engine being built on Etherion's own infrastructure — the next stage of this work, not a capability of this release.
Daily observability by reader level
The same evidence becomes practical instructions for field workers, inspectable context for agronomists, and regional briefs for cooperatives.
Operations over one state
Prediction, simulation, speculation, windback, and intervention run over one maintained predictive state, with the evidence path preserved.
Organizational data sovereignty
The organization is to retain full sovereignty over the raw data Messis produces for it. Insight can travel; ownership of observations remains with the organization.
Measured versus in development
This section describes the delivery layer under construction. The only measured result on this page is the next-state benchmark above.